The benchmark for Shariah-compliant equity, the KMI-30 index, registered a significant decline on April 9, 2026, closing at 241,192.40 points. The market action, which saw a point decrease of -1,611.26, or -0.66%, indicates a climate of heightened caution among investors. The day was a microcosm of a larger struggle between competing long-term growth and short-term headwinds, making future market direction difficult to predict.
The Day’s Cycle: From High Hopes to a Soft Close
The index opened with a positive tone at 243,905.61 and swiflty touched its intraday high of exactly 243,905.61. However, this early momentum was immediately met with selling pressure, leading to a precipitous intraday fall to a low of 236,341.80. This significant swing suggests a highly volatile and conviction-light market environment. While a partial recovery pushed the index back above the 241,000 mark by the close, the inability to challenge the day’s early highs sets a cautious tone. The broad trading range of over 7,500 points confirms that volatility is now a primary market feature.
Volume Dynamics
Volume for the index constituent shares was 220.37 million, a healthy and liquid level of participation. This volume confirms that price movements were backed by real activity, giving the daily data greater credibility. However, it also suggests that there was significant profit-taking and liquidation, especially at higher levels.
The Dual-Track Narrative: FYTD vs. CYTD
The conflicting signals are best encapsulated in the long-term metrics. The index has posted a stellar +30.45% growth in Fiscal Year to Date (FYTD), which should fundamentally bolster long-term investor confidence. However, the short-term Calendar Year to Date (CYTD) performance shows a decline of -2.96%.
This divergence is the market’s primary narrative. It suggests that while the fundamental story (FYTD) is powerful, investors are currently reacting to short-term cyclical or sectoral pressures (CYTD), preventing a clean upward breakout. Today’s close of -1,611.26 points further contributes to the CYTD pressure, reinforcing the need for strategic positioning.
Analyzing the Specific Drivers: A Market Split
The day’s performance was essentially a story of strong ‘Pullers’ versus even stronger ‘Draggers.’ On the positive side, LUCK Cement Limited (LUCK) emerged as a massive outlier, adding a vital +419.13 points to the index. This gain single-handedly cushioned the market against a deeper fall. The cement sector provided broad support, with Fauji Cement Company Limited (FCCL, +312.53 points) and D.G. Khan Cement Company Limited (DGKC, +281.94 points) all finishing strong.
However, the drag was overwhelming. Mari Petroleum Company Limited (MARI) emerged as a powerful negative influence, shaving off -496.47 points. The negative effect was compounded by other heavyweights like Hub Power Company Limited (HUBC, -441.04 points), Meezan Bank Limited (MEBL, -332.20 points), OGDC (-329.96 points), and Systems Limited (SYS, -273.00 points).
In conclusion, the net negative shift of -1,611.26 points confirms that the downward pressure from this strong group of draggers was overwhelming for the pullers to overcome, highlighting that investor caution is currently the prudent stance in a market dominated by conflicting signals and sector-specific friction.
| Metric | Value / Figure | Details / Contribution |
|---|---|---|
| KMI-30 Index | Value | |
| Open | 243,905.61 | Starting point |
| High | 243,905.61 | Intraday peak |
| Low | 236,341.80 | Intraday trough |
| Close | 241,192.40 | Final level |
| Change (Points) | -1,611.26 | Net point decline |
| Market Metrics | Value | |
| % Change | -0.66% | Net percentage change |
| Index Constituent Volume | 220.37 Mn | Shares traded |
| FYTD (Fiscal Year to Date) | +30.45% | Long-term performance |
| CYTD (Calendar Year to Date) | -2.96% | Year-to-date performance |
| KMI-30 Pullers | Stock Symbol | Points Contribution |
| 1. Top Puller | LUCK | +419.13 |
| 2. Second Puller | FCCL | +312.53 |
| 3. Third Puller | DGKC | +281.94 |
| 4. Fourth Puller | MLCF | +208.45 |
| 5. Fifth Puller | SAZEW | +187.94 |
| KMI-30 Draggers | Stock Symbol | Points Contribution |
| 1. Top Dragger | MARI | -496.47 |
| 2. Second Dragger | HUBC | -441.04 |
| 3. Third Dragger | MEBL | -332.20 |
| 4. Fourth Dragger | OGDC | -329.96 |
| 5. Fifth Dragger | SYS | -273.00 |
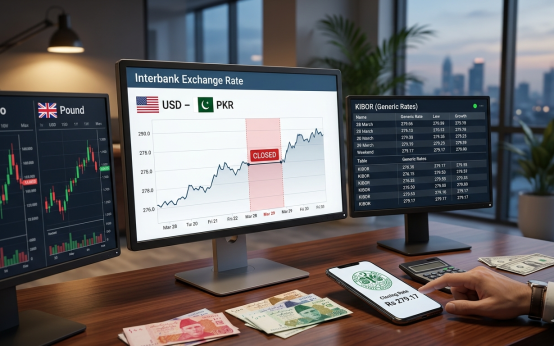 Interbank Currency Pakistan Today – 11 April 2026
  Gold Price in Pakistan – 09 April 2026